The Path of Most Resistance: Embracing ‘Messy’ Humanities Data and Unpolished Projects
This is a minimally edited transcript of a talk I gave for the DHRI South Bend Speaker Series at Hesburgh Libraries at the University of Notre Dame on February 19,2019. Thank you to Sarah Noonan (Saint Mary’s College) and Daniel Johnson (University of Notre Dame) for the invitation and the opportunity to meet the fantastic folks at Saint Mary’s and Notre Dame.
This talk builds on a presentation I gave at Digital Humanities 2018 entitled Critical Data Literacy in the Humanities Classroom, as well as my 2017 DHQ article Digital Humanities Pedagogy as Essential Liberal Education: A Framework for Curriculum Development
Up until about a month ago, I was the Director of LEADR, the Lab for the Education and Advancement in Digital Research, in the History and Anthropology Departments at Michigan State University. Most of what I’ll be talking about here is based on my four and a half years in that position and the courses I worked on during that time. LEADR is a physical lab, but it’s also a curricular initatiative—we worked with faculty members in those history and anthropology to implement digital projects in courses of all levels.
At MSU, I worked on more than 100 courses, and only a handful of them were “digital humanities” or digital methods courses. Almost all of them were standard content-based courses that had digital components. Sometimes this meant having one or two in-class sessions where students would visualizations or find some digital resources and reflect on the process, but for most of the courses, we were working towards a large final digital project.
For each of these classes, I would meet with the course’s instructor beforehand to discuss the digital project they were interested in and sketch out the schedule for the semester. The instructors almost always led with a deliverable—for example, they wanted to emulate a mapping project they’d seen earlier, they thought podcasts or short videos would sound interesting, or maybe they just wanted to make websites because they were tired of grading the same 20 10-page papers that end up in the trash by the end of the semester. Once we had that final project in mind, our staff would usually try to think of the easiest way to get the students to that final deliverable.
After pragmatically tackling many digital projects in in the first few years, I came to reflect on this process with much more of a critical eye, and I’ve found that we should have thought much more critically about why we’re using the technologies we’re using in the classroom. And today I want to talk more about why we may want to select the path of most resistance—in short, projects that are less fun for everyone involved and look worse in the end.
To give you a brief roadmap for my time here today, I’m first going to talk about what typically motivates instructors to do digital projects in the first place, then I’m going to then make a case for the motivation I think is most valuable for our students, and then I’ll talk about how we can work to accomplish these goals in the classroom.
Motivations for Digital Scholarship in Undergraduate Classes
One thing that’s been really interesting to me in conversations with faculty, and in the digital humanities world more broadly, is why we’re doing this in the first place. Why do we feel compelled to throw our old syllabi out the window and lean on web-based services that crash, or change their interface the day before class, or have 15 different software installation issues in a class of 20 students, or put ourselves out there to struggle and fail with technology.
Nearly every motivation I’ve heard can fit into at least one of three categories.
First, a lot of faculty are interested in doing something different. They’re tired of reading all the same term papers, and they assume students are sick of them too, and they just want to shake things up with different forms of media like websites, podcasts, and videos, or maybe creating an interactive map.
Students Will Love It!
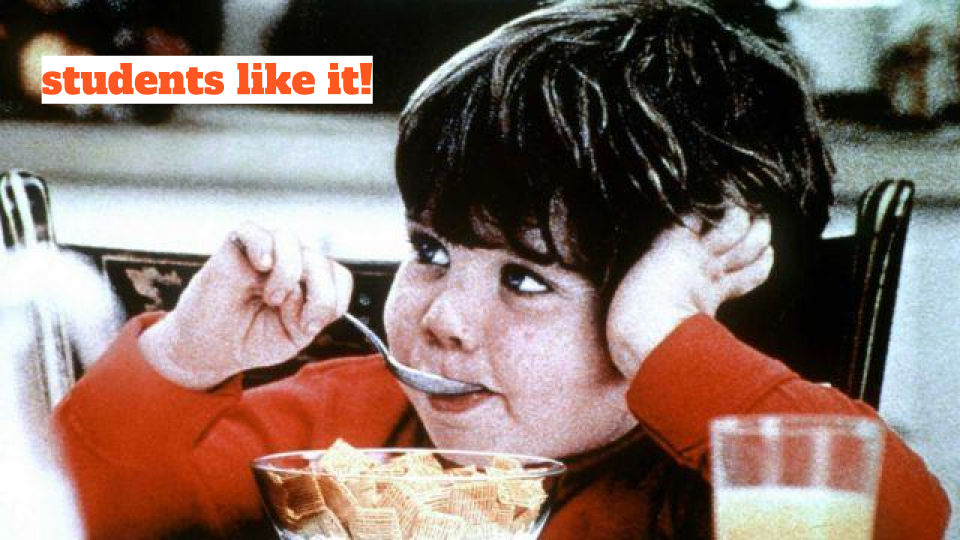
This is a great thing—there’s nothing wrong with trying something new and trying to get students excited by engaging in different forms of media.
I do think it’s important to keep in mind that a lot of students are actually a little resistant to this. Ryan Cordell, in his Debates in DH chapter “How Not to Teach Digital Humanities” argues that hearing “digital humanities” may cause dread in some students:
Far from signaling our cutting-edge research and teaching, I suspect that the phrase “digital humanities” often raises perfectly valid worries with our students, many of whom have spent their entire educational careers sleepwalking through ed tech nightmares…[O]ur students’ perceptions of educational technology are bound to shade their readings of tech in humanities classrooms.
When students hear ‘Digital Humanities’ or perhaps when they learn that there will be a digital final project in a course where they assumed they’d be writing a paper, they don’t think necessarily about emulating a project like the Colored Conventions Project or the Whitman Archive, or think about the incredible possibilities of text mining 19th century novels. They likely think of the smart boards they had in their elementary and high school classrooms that never seemed to work right, or the iPads their school purchased and put in the classroom without fully developing a curriculum that took advantage of them, or perhaps they experienced motion sickness when their teacher or a classmate first discovered Prezi.
A 2017 Educause survey of undergraduates found that less than a third of students said that all or almost all of the faculty they’ve encountered use technology adequately in courses. This data aligns with the 2011 Educause Survey that Cordell cited in his chapter. So it doesn’t really seem like we’ve made much progress in the last few years in this area. There’s also been a fair amount of anecdotal data in the digital humanities community that students are less likely to take classes with digital in the title. I’ve also personally encountered a lot of students who are quite comfortable with papers, and really resist when they’re asked to step out of the box and do something different—grades are a high-stakes ordeal for students, and new, experimental assignments are not always welcome.
So again, I think that shaking things up with some digital work can (and often is!) a fun experience for students, but we shouldn’t think that throwing more technology at students will engage them any more than another type of assignment. It’s much more about good pedagogy, scaffolding, and assignment design than it is about the tech or media you’re using.
Public-Facing Scholarship
Another motivation for digital scholarship in the classroom I often encountered is that faculty are interested in creating public projects.
Instructors want the students to have something for their portfolios. In some cases the instructors want something for their portfolios.[1] Perhaps they know of some collection or topic that they think is important, but a bit under-studied. Many of the projects that I’ve been most excited about and and most proud of really had this public-facing focus.

These two projects I worked on in LEADR - both with John Aerni-Flessner-have gotten a lot of attention at the city and state level, and have helped to tell stories that aren’t all that well known in the area.
On the left, we have Lansing Urban Renewal a project that tells the story of the people affected and the homes that were destroyed when the Interstate split Lansing in half. On the left is Malcolm’s Lansing a series of tours for people to learn more about Malcolm X’s experiences growing up in mid-Michigan.
Not only are these services to the community, but they also help to teach students to write for and engage with a broader audience, not just writing to their professor. These are really worthwhile endeavors for courses.
However, projects like these are hard to do at scale. For most History classes, particularly at the 100, 200, and 300 levels, students are expected to look at some common or well-known primary sources, synthesize some secondary sources, and pull that together into a final project. In many of these cases, students are writing their papers on Roman aqueducts, the role of the railroad in western US expansion, gender representation in 20th century fiction—the standard types of things students do to learn how to work in the field and think critically about a topic.
But these are well-trod areas where their digital project would drown in a sea of more well-known and more substantial projects on the web. They are hypothetically learning to communicate with a broad audience, but it’s an audience that’s very hard to reach. I would argue that a more effective public intervention in these cases is probably to have students write a paper and then create or edit a Wikipedia page to reflect their synthesis.
We also have a Michigan History course where each of the 100 students creates a project about a Michigan town of their choice. These also get a good amount of traffic, a fair amount of incoming links, and the occasional email. We’ve done that every year for 5 years and I have to tell you…there aren’t that many towns in Michigan. The world only needs so many history projects on Grosse Point, Michigan.
Digital/Data Literacy
The final reason that sometimes comes up is the desire to develop students’ digital skills and literacies and their ability to work with and critique data. These are the motivations that I’m most interested in, and the ones that I want into dig into a bit more today.
Digital Literacy
There are many different definitions, interpretations, and highly specialized frameworks for digital literacy in circulation today. The way that I generally like to approach digital literacy is to piggyback off of the American Library Association’s definition.
ALA defines digital literacy as “the ability to use information and communication technologies to find, understand, evaluate, create, and communicate digital information, an ability that requires both cognitive and technical skills” (ALA 2013)
I primarily think about this as knowing how to create effective digital content, including how to write for the web, how to craft a multimodal website, how to edit audio and video, and how to create interactive visualizations and infographics. Digital literacy has important applications outside of the classroom—it’s important for students to understand how to create things and advocate for themselves on the open web, rather than relying solely on social media platforms. I often did informal surveys with students when they came into LEADR, and although every student used some kind of social media, we usually only saw 3-4 out of every 20 person class who had ever created a website before, and they had often only done that in a prior digital humanities class.
Facebook is a great way to reach people, but more and more people, especially people under 25, don’t want to use Facebook. During the #DeleteFacebook movement a few months ago, a lot of people were saying that they wanted to leave Facebook, but couldn’t because of the had a small business whose only online presence was a FB page, or because of local events and political organizing.
Many social media platforms will remove content or ban groups, or ban people for not using their legal names. Because of scrutiny following the 2016 US election, Facebook now requires legal documentation for ads that have any kind of political content. It’s not just electoral ads, it’s any ad that includes a really broad list of political terms, and will hold up any ads you have until you provide documentation. You have to give up a lot of privacy in order to use Facebook for this kind of political advocacy.
I assume everyone here is at least a little familiar with some of the horrendous problems that have been brought to light in recent years at Michigan State. As you can probably imagine, there was and continues to be a lot of student activism surrounding university governance, and their lack of action to dismiss Nassar and those who protected him.
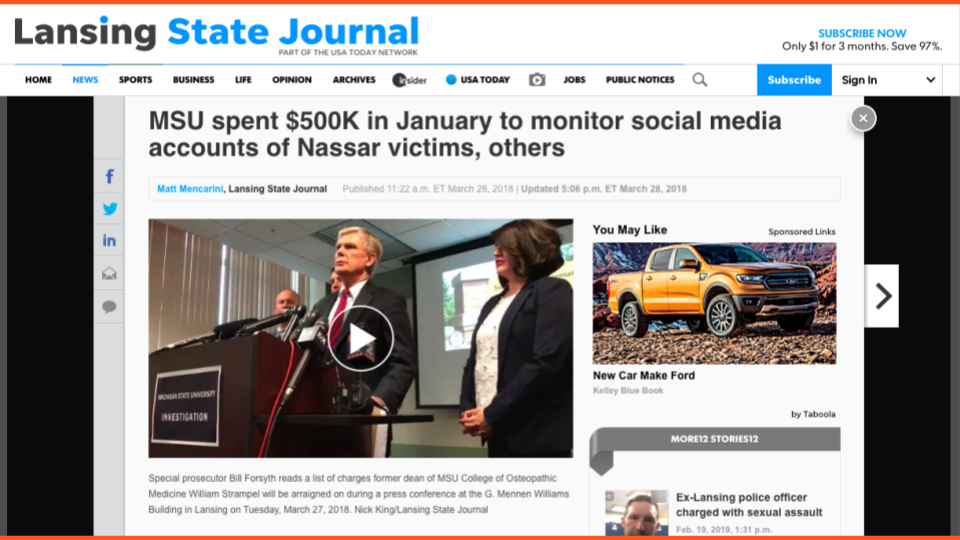
About a year ago, it was revealed that the former interim president John Engler paid a firm over a half a million dollars to monitor social media, including the social media of the Nassar survivors and others who were critical of the university. The report quoted many of the survivors’ tweets, and even included the number of likes and retweets they had on their tweets and Instagram posts. Also around a year ago, Richard Spencer made a visit to MSU, and many of the students who were interested in organizing against him had their names, images, and contact information leaked because people could see who was in the group, who had RSVP’d to events, and who was taking part. There are different organizations out there that just look for student activists, publicize their work, and encourage people to harass them. MSU Police were also infiltrating student groups and survielling anti-Spencer activities.
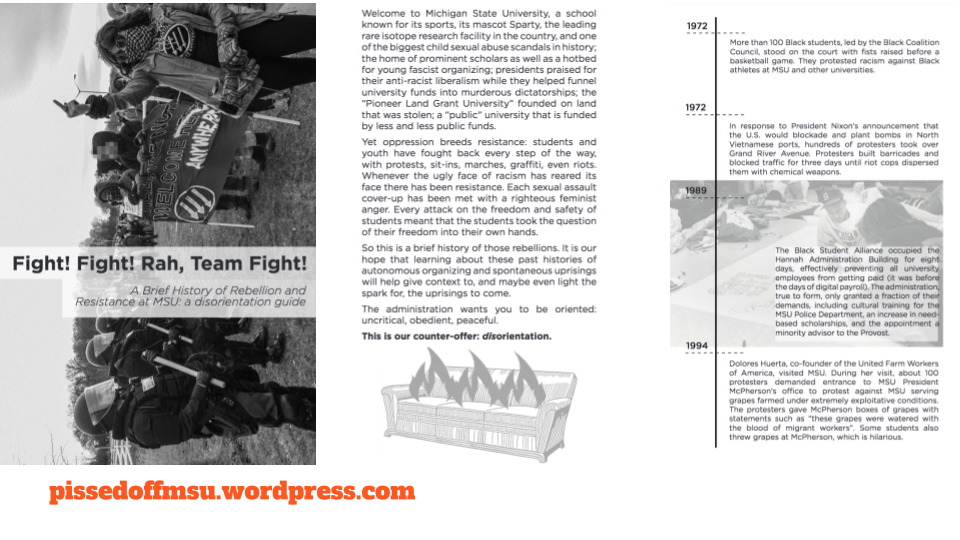
This example here is a from student group at MSU that put out a ‘disorientation guide’ at the start of this academic school year that highlights some of the current scandals at MSU, while tracing back the long history of campus activism.[2] They put out a zine, and have their own website for updated versions of the zine. They also have a contact form, a running blog, and they’re able to do this all anonymously via a wordpress.com site because it doesn’t have the restrictions that Facebook does. Another student activist group has struggled to maintain momentum over the past few years because they’re constantly getting kicked off Facebook and then have to rebuild their following.
That was kind of a very long way of saying is that digital literacy encapsulates very real, very important advocacy and communication skills, and they’re not skills that students are always coming to campus with.
I don’t know that I have some kind of silver bullet liberatory method for teaching these types of skills, or enabling this kind of work, but I think it underscores the value in focusing on the learning process and having students think through open-ended questions about structure and content when it’s possible.
Thinking about a frictionless path to the final project, as I described at the beginning of this talk, usually lends itself to pre-fabricating sites, making the decisions for the students, and then having students enter the content in their assigned space. It makes it difficult for the students to reproduce on their own outside of class. If we were instead to have students use Reclaim Hosting (either Domain of One’s Own or independent purchasing) or Markdown, HTML/CSS, and Github Pages, students would then have at least a glimpse at the entire process for creating a website from scratch.
Data Literacy
I now want to transition to data literacy. For many students-particularly those who aren’t conducting research in the sciences-data is something they hear about all the time, don’t actually see very often, and work with basically never.
There are lots of different frameworks and guides out there that could be used for data literacy, and since so many students are so new to the use of data, it can be difficult to determine where to start, and what skills and literacies need to be included.
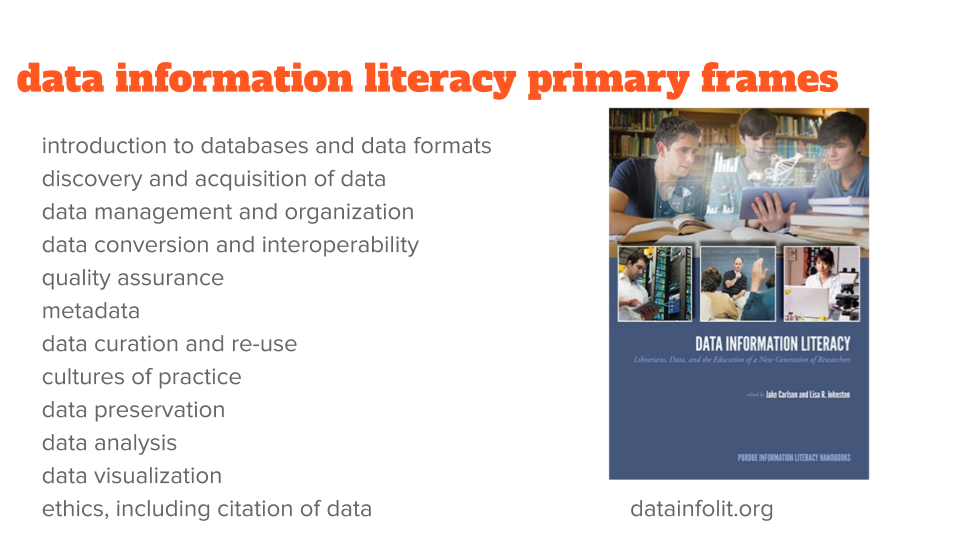
The framework I’ve used in research-intensive classroom situations is the Data Information Literacy (DIL) initiative. Although it’s not necessarily designed for the undergraduate Humanities classroom, the frames helpfully break down the kinds of things one must know to work with data, and the approach that focuses on situating teaching within the practices of the field is crucially important.
It’s a great way to teach a data-intensive research process, and also includes a lot of really fundamental goals like understanding data and database formats and practices, metadata, ethics, and data analysis and visualization.
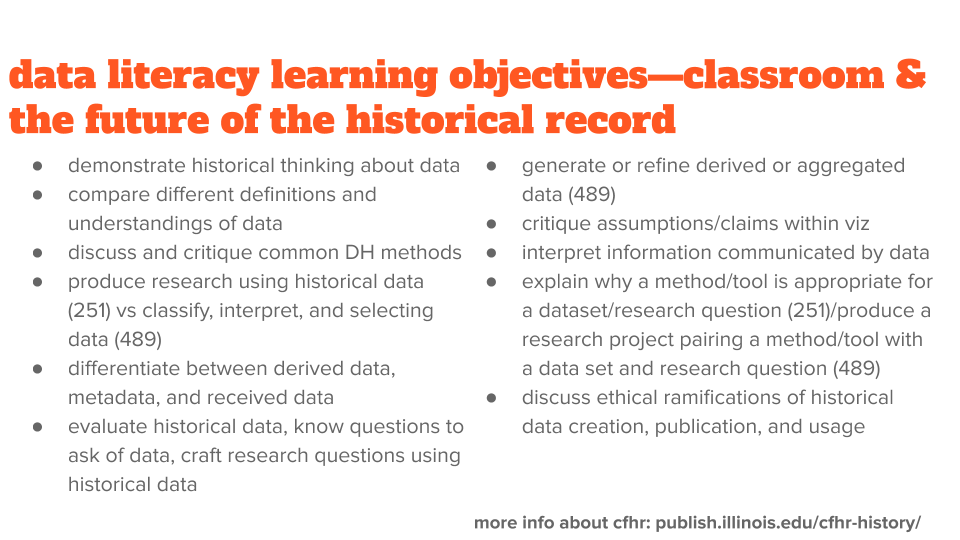
Alongside Sharon Leon, Alyssa Lopez, and Alice Lynn McMichael, I’m working on a study to determine best practices (or, more accurately, better practices) for teaching historical data in the undergraduate classroom. This is one component of the Humanities Without Walls-funded “Classroom and the Future of the Historical Record” project with colleagues at the University of Illinois at Urbana-Champaign and the University of Nebraska-Lincoln. I’ll talk a little bit more about this project near the end of the talk. These are the learning objectives that we’ve settled on for teaching two History methods courses - one at the 200 level and one at the 400 level.
While these goals are primarily focused on the scholarly use of historical data (some exclusively so), we are teaching these with some “everyday” uses in mind too. More and more parts of our lives are being determined by the collection and use of data—in scientific communication, electoral campaigns, and in the ads we see on the web.
Data and data visualization are commonly used in political advocacy, in science and social science research results, and in the news, and it’s not always easy to dig in and evaluate some of the underlying assumptions and implied claims. Data literacy provides individuals with tools to critically assess work like this from data collection through the final project. Alberto Cairo at the University of Miami and the “Calling Bullshit” initiative at the University of Washington both model approaches to interrogating these types of claims, though they are mostly focused on statistics and visualization.
Collection of personal data has become a mundane part of everyday life through the surveillance capitalism of Facebook, Amazon, and Google, as well as the practices of law enforcement agencies as they develop alleged gang and terrorism databases and track individuals at scale.
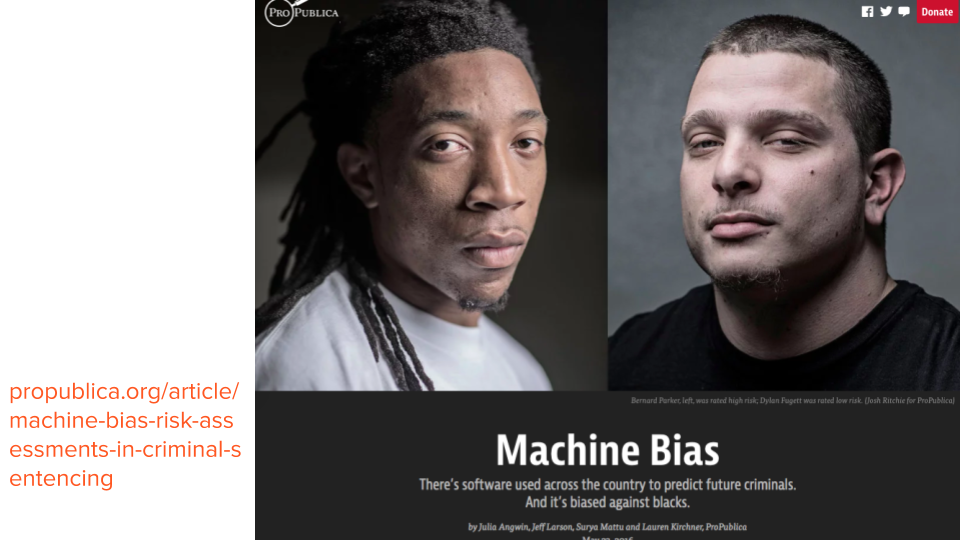
More and more local and state governments are using predictive policing and bail algorithms to eliminate biases. Many people see that as a good thing—they think “OK, we know that these police officers and judges are biased against people of color, so if we outsource these decisions to algorithms, we can make sure everyone is treated fairly.” But of course, the data is biased, and so are the algorithms, so you end up with the same structural racism, you just no longer have “a few bad apples” to blame.
Most people haven’t really worked with or thought critically about data. Most people only vaguely know what an algorithm is. And many people aren’t able to critically engage with these practices because they are shrouded in an idea that this is all science and math and that science and math are not ideological.
I do want to be clear, of course, that there’s a lot more going on in these situations than just a lack of technical knowledge, but it does make it difficult when even well-meaning people can’t effectively enagage with the issues.
Before the NSA’s PRISM program was revealed to the public in 2013, few people really knew what metadata was, or how it could really be used. And if you remember, after the news broke, many were defending it by saying “well, it’s just METADATA, it’s not like the NSA was recording the calls.”
In response to these reactions, Kieran Healy, a sociologist at Duke, wrote an article for Slate entitled ‘Using Metadata to Find Paul Revere.’
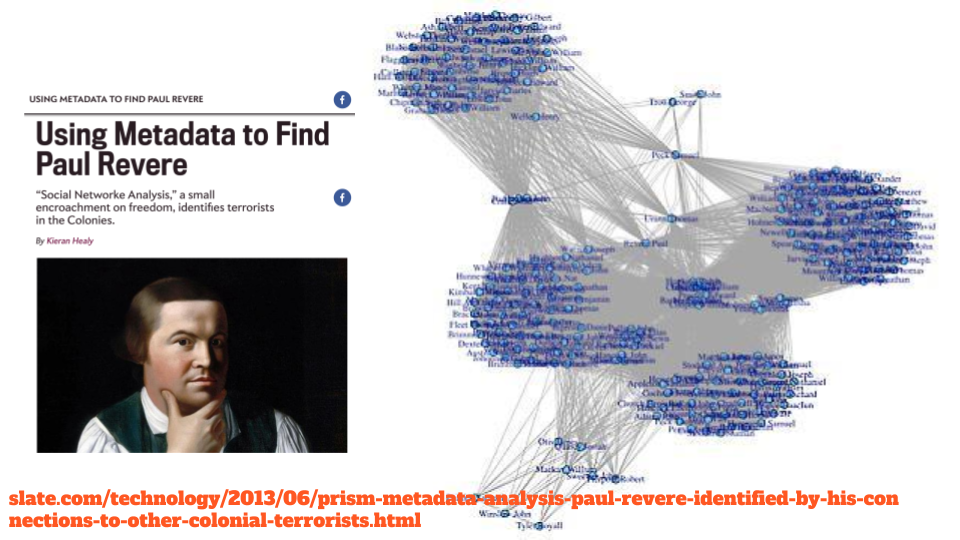
It demonstrated the power of metadata really effectively. He pretended to be an 18th century British agent using social network analysis, in much the same way the NSA, CIA, and FBI do, to find people who may be key connectors in the American Independence movement by analyzing the rolls of different organizations and groups. By looking at just this information, he was able to find out that Paul Revere was involved in many different groups and was able to bridge this larger network and relay information between otherwise separate networks. In character as a British agent, he calls on the Royal government to keep an eye on Revere.
If you haven’t done work with metadata…perhaps you haven’t visualized the work of historian David Hackett Fischer on Paul Revere’s social network…then it may not be as easy to understand what can be done with massive amounts of communications metadata.
Beyond critiquing data-driven policies and practices, there are also opportunities to use data in civic life. Governments are increasingly making the data they have created available for public use, including census data, traffic stops and crime reports, information about schools, restaurant health inspection results, etc. We can also include similar data that may be collected by academic researchers, NGOs, journalists, and watchdog organizations that touch on similar topics.
Government data publication is often done under the banner of greater transparency, or in providing data that is crucial for businesses and nonprofits to operate. However, this data is often published via APIs or other platforms that require some technical skill to access. Civic data also often comes in strange formats that have been quickly exported without correction or reformatting from proprietary software, and in spaces and formats that don’t make them easily communicable with other useful datasets. That means that the information is out there, but it may not be accessible-or effectively usable-for people who haven’t been trained on data manipulation and analysis.
The California Civic Data Coalition, a group of journalists and programmers, developed a complex workflow for California political spending because that data is 36 million records spread across 76 data tables. So if you were thinking about seeing who supported or opposed marijuana legalization, you can’t just open a spreadsheet and find out. (Well, now you can thanks to the California Civic Data Coalition, but not organically.)
When I downloaded Lansing Michigan’s police traffic stop data, the time field had erroneously appended the date they uploaded the data to every single row, and there were many other irregularities and errors with the data. Just getting the time and date correct is about 40 steps in OpenRefine, and it took me several hours to figure out what the dates were supposed to be, and how I could correct and combine those fields.
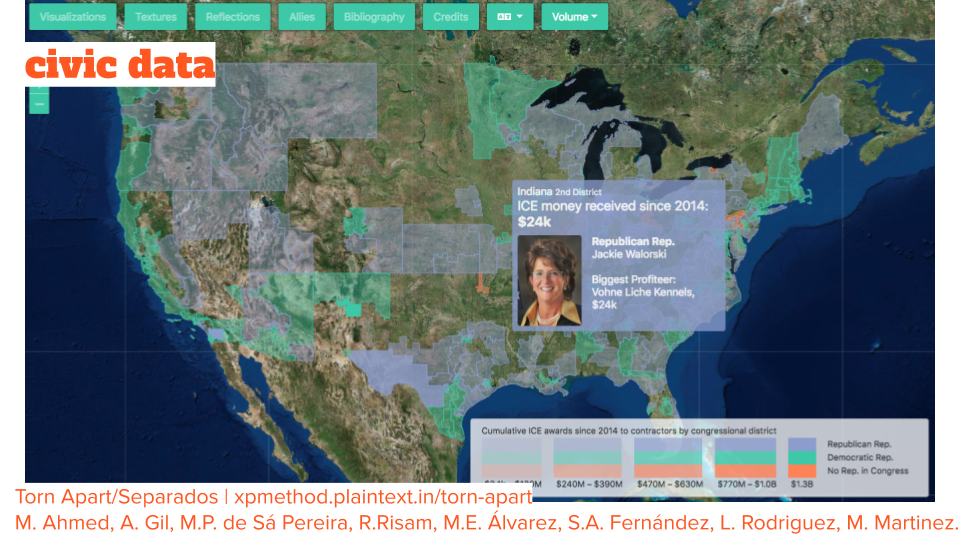
The Torn Apart/Separados project, which examines where the spaces of immigration detention are located and who is profiting from their operation, was conceived of and launched in about a week this past summer, with a second volume published a few months later. This project garnered press from Wired, Inside Higher Ed, Feministing, and local news agencies, and also enabled activists around the country to know who in their district was profiting from immigrant detention for more focused work. This is just one example of the political power that a few private citizens with domain knowledge and technical skill can wield with a few bits of scattered open data.
Humanities Value of Data Work
I also want to be clear that data literacy isn’t only valuable because it has some value outside of the classroom. Discussing humanities datasets, whether it’s a full semester-long course focused on the curation and analysis of a dataset, or a one-shot data visualization workshop in the context of an otherwise standard course, allows for a lot of critical thinking about humanities materials and the nature of their analysis in many contexts.
One of the most straightforward ways we can get into the lack of objectivity and the complexities of humanities data, is to just have students come up with a metadata schema and a few rows of sample data for some collection of interest.
Lauren Tilton and I did this at the Humanities Intensive Learning and Teaching institute last summer.[2] We had participants (a mix of humanities faculty, humanities graduate students, and librarians) break into groups and come up with a data schema and sample data for all of the Oscar-winning movies for a given decade. We then had all of the groups share what they came up with, and everyone had vastly different schemas and formats. A lot of this was because groups had decided they were really interested in researching particular questions: How many of the movies had a person of color as a director or in a leading role? What kinds of actor & actress networks could we catalog by putting full casts in? How much did the film cost and how much did it cost to make?
In the undergraduate classroom, this is a great jumping off point for a discussion of what constitutes a humanities question, or how we may think about the categories of information we need to investigate those questions.
The other conversation that comes out of this activity is that groups often decide to encode the same information in different ways. For example, one may just record the director’s city of birth. Others may do city and state in one column. Still others may do a city column and a state column. And then they encounter someone who was born in a county, or the precise birthplace is unknown, or was born in a country that doesn’t have a good proxy for state, and then the entire schema needs to be reevaluated. And even then, with text names of birthplace, we don’t really have something that can easily be put on a map. While this is a somewhat simple issue, it leads to discussions about standardization and determining what underlying values you have that will ultimately decide how you’re coding things.
On this topic, I love to bring in Thomas Padilla’s work on data normalization in the Cartoonists of Color Database.
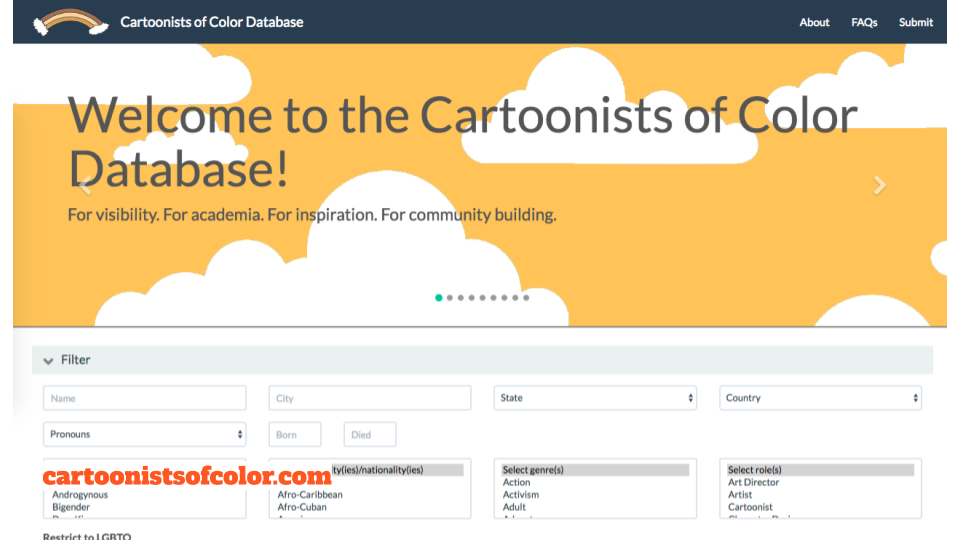
A few years ago, Thomas helped to make the database of over 800 cartoonists available as a download. When he encountered the ethnicity data field, he found more than 160 unique descriptions, such as “mixed, black”, “African American”, “African-American + Afro-Bermudian / Irish-American”). These fields were usually either taken from cartoonist’s bios in books or website, or were entered by the cartoonists themselves.
For someone who works with a lot of data, the natural inclination is to try to normalize that data. That many different categories would cause a headache for someone who wanted to make a simple visualization of the makeup of the database. It would also be a challenge for someone who just wanted to see a list of, for example, black cartoonists.
However, normalization flattens identities, and would require making a lot of assumptions about the people in the databases. Ultimately, Thomas warned users of the potential effects of this normalization on this rich and complex biographical information
Data derived from the database have been minimally normalized. In some cases, data have not been normalized at all. I leave this to the discretion of the data user, but I would say to tread ethically. While the ethnicity data field contains more than 160 different types, […] some of which you could interpret as acceptable candidates for normalization, keep in mind what the act of normalization does. Especially in light of the connection between data point and identity. Take the diversity of the data as a challenge. Strain those data models. Where they don’t work, cast them aside. Perhaps make something new. -Thomas Padilla, Diversity, Comics, and Beyond: Announcing the Cartoonists of Color Datasets
Last Fall, I taught a senior seminar on data and digital sources in historical research. We had lots of conversations about the absences in the historical record and the ideology that goes into the way records are collected, schemas are made, data is published, and also the assumptions and ideologies within our methods and tools.
To get into a larger conversation, I had my students read some of Safiya Noble’s ‘Algorithms of Oppression.’ If you’re not familiar, Noble studies Google search results and the way that private interests, racist tropes, sexist tropes, and especially private interests in racist and sexist tropes, play a big role in Google results.
I made the decision to use Noble’s work, a reading that talked about issues in contemporary society, as a way to get into the issues of historical data collection and interpretation.
I was actually a little nervous that we wouldn’t really be able to connect Google’s commercial algorithms with, say, assumptions made by mapping software or the use of colonial archives. But the students really got it. It offered us a good entry point for some of these issues, and several students said that it was the first time that they had thought critically about search results. It also turned into an interesting conversation about privacy and doxing, both for people from the past and people in the present day.
Integrating Digital & Data Literacy into the Classroom
I want to return now, for a moment, to the meetings with faculty I was describing earlier. In the projects that I’ve worked on, and in conversations with others I’ve encountered, the conversation usually starts with a final product and works itself back.
“We want to create a map of these things, how can we structure the class to do that as painlessly as possible?”
This is a very logical thought process—why wouldn’t you take the easiest route to the result you want? But it can also lead to removing a lot of the hard parts that can develop useful skills.
It usually means using pre-prepared, pre-“cleaned” datasets, because organizing and preparing data is usually 80% of the work of data analysis. By saving the time and trouble of organizing data, students don’t have to think as critically about the structures and content of the data, and they don’t learn how to prepare data for the types of analysis they want to do. Then, when they want to repeat the process on their own (perhaps they want to see if there’s racial bias in Lansing Michigan’s traffic stops?) they’re completely blindsided.[3]
Starting with the final product also usually means having someone (either the instructor or a collaborator) setting up and designing a site for themselves. That, again, means that if a student wishes to create their own website, they may know how to write for the web, and they may understand how to use the Wordpress WYSIWYG editor, but they haven’t had the experience of finding web hosting, of customizing a CMS, writing CSS and HTML, or anything else like that.
Ultimately, I believe embracing the use of un-prepared datasets and more hands-on product creation leads to a better fulfillment of digital and data literacy goals, even if the final projects end up slightly less impressive.
I do want to reiterate that I don’t think every digital project needs to lean into the more difficult parts of this process. I think that if you want to make a public-facing project that shows off a unique collection, or a unique vantage point, then I think streamlining the project is totally fine—there’s a different motivation behind it.
Taking the path of most resistance, of course, is a really difficult thing to do. Not only are you potentially limiting the project, you’re putting more demand on the instructor and any other support resources, and you’re likely causing a lot of additional anxiety and frustration for students.
But there are ways to integrate these types of learning goals into classes while having fewer headaches.
Data Scaffolding

On the left, we have a dataset that someone has already pre-prepared for analysis. You can just pop it into the data visualization software and you have your graph. On the right we have our humanities data in its natural state—on shelves. It requires processing and a lot of small decisions to get it from those shelves into some kind of analysis. It’s hard to teach a class with grocery store data unless the class is really focused on preparation and processing.
To make the data organization and refining process possible in the context of a single-semester course where we talk about things other than data organization and refining, we have to simulate these steps using a series of workshops and discussions. You can teach students how to work through the types of issues they’ll encounter and decisions they’ll need to make without making them normalize every bit of text or work through every single character encoding issue.
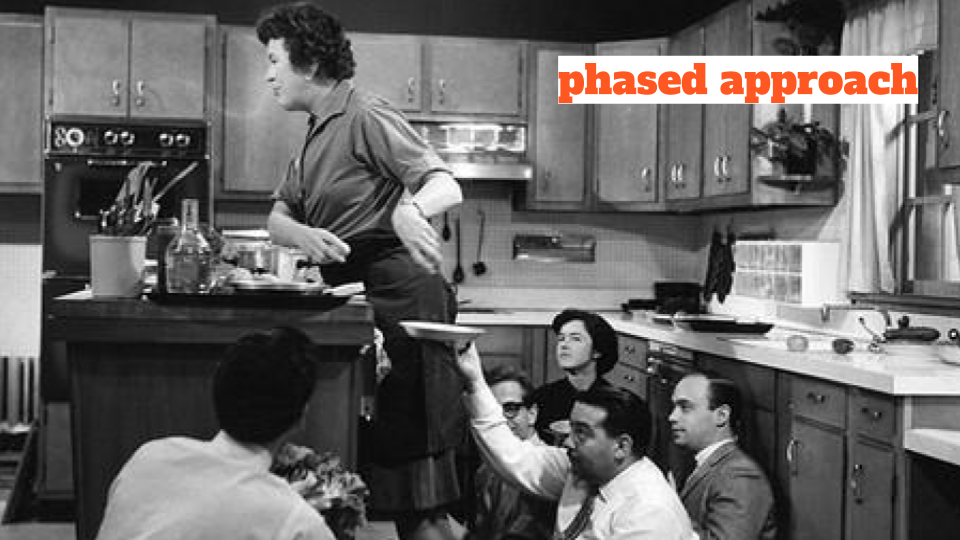
Like a cooking show.[4]
In the first class, we may introduce digital surrogates or physical objects and ask questions about how we may represent them in data. We can also ask about the ethics of creating this dataset, and determine what we need to know about the context in which the objects and/or surrogates were created. We can also talk about metadata fields and standards, determine what types of questions we can ask, how we can create data that facilitates those questions.
For the second session, we may give them a dataset that has been assembled from several different sources and has some inconsistencies. Students can then learn how to work with unorganized or “dirty” data and make sense of what’s given to them. They can learn the necessary headaches of standards and the magic of OpenRefine.
After this step, students can grab a pre-prepared dataset (inasmuch as that is possible) and focus on project-based analysis.
You can scaffold and simulate the type of work students would be doing while keeping it contained within a few classes. Students can learn how to think through and solve these problems without having their projects delayed by data issues.
The most important factor is being generous with your expectations and clearly communicating these with students. This is just generally good pedagogy, but I think it becomes especially important in spaces like this where you’re asking students to really go out on a limb and do things they’ve never done before without knowing what the results are going to be. Talk about your learning objectives, why you’ve chosen them, and be clear about how they may be useful for them outside of the classroom. Discuss failure, and be clear that projects flop and that a failed project doesn’t mean a bad grade. A brief essay explaining how their project failed, what they would have needed for it to work, or what mistakes they have made is a far better learning experience than a project where they simply plugged a spreadsheet into a visualization tool and described the results. Make sure that information they’re given about their grades reflects that.
Classroom and the Future of the Historial Record
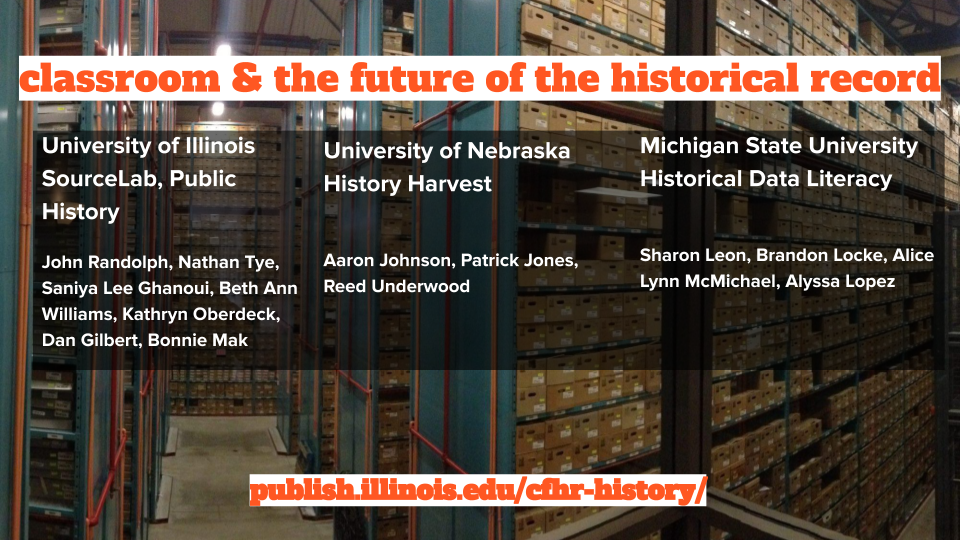
I also want to add that, um, this advice is subject to change. We’re about halfway through our first year of the Classroom and the Future of the Historical Record research project. I briefly discussed our work at MSU on teaching students to engage with historical data, but we’re also working with colleagues at the University of Illinois and the University of Nebraska.
At the University of Illinois, faculty and grad students from the Department of History and the iSchool are working through digital scholarly editing through their SourceLab project, and are also starting a History Harvest program in their public history focus.
At the University of Nebraska, faculty and grad students in History and Education are working on integrating History Harvests into the K-12 classroom, and finding ways to build this process into the state curriculum through elementary, middle, and high school.
We’ll be presenting our findings at conferences over the next couple of years, including at AHA in 2020.
Conclusion
It feels a bit cliché to even say it at this pont, but our news, communications, consumer choices, political activism, and work lives are increasingly online, where our actions and choices are logged, monitored, and stored by corporations and governments. This data, combined with algorithms, UX design, and other technical infrastructure influences the news articles we see, the number of police in our neighborhoods, the amount of welfare we recieve (and if we can receive it), and then answers we get when we type a question into a search box. At the same time, for many people in the broader public, we also have this idea that databases and algorithms are neutral, and that they can actually benefit society by making things more fair.
Media, information, and technology scholars like Safiya Noble, Douglas Rushkoff, Anna Lauren Hoffman, Cathy O’Neil, Lisa Gitelman, Shoshana Zuboff and Virginia Eubanks, among many others, have been saying for years that we need to keep in mind that there are people with biases creating these tools and there are ideologies behind all of these structures. However, that hasn’t been reaching broad populations quite yet.
While the idea of the humanities classroom as a space to learn critical approaches to technologies may seem a little strange, I think the humanities classroom is actually an excellent space to tackle these types of issues. We can tell people all day that these technologies are full of peoples’ decisions and ideologies, but it doesn’t register as well until you’ve done the work yourself. And topics in the humanities offer incredible opportunities to dig into the complexities of the people, texts, and objects you’re modeling, and to show first-hand how influential these tiny decisions can be on the final product.
In all of the real-world applications I’ve mentioned here — particularly in government and capitalist surveillance—the power dynamics in who caputures, holds, and uses these data technologies make all of the difference. The humanities classroom is already an environment where students develop an understanding of how power, control, and surveillance are wielded against marginalized people.
I am proposing that when we develop digital projects in our classrooms, we focus on the learning process over the product, and structure it so that our students are learning these critical approaches, not just making nice looking, easy projects.
- Faculty exploitation of student work is certainly not limited to digital scholarship, but digital scholarship does open up many avenues for intentional and unintentional exploitation. See Spencer D.C. Keralis’s “Disrupting Labor in Digital Humanities; or, The Classroom Is Not Your Crowd” and Miriam Posner et al.’s “A Student Collaborators’ Bill of Rights
- This was based on an activity that Lauren had used in an earlier class, and I have shamelessly stolen the activity for a number of classes and institutes following this.
- To be fair, no data organizing is the same, so it’s still very possible that they’ll be hit with something they haven’t seen before. But they can at least be familiar with the process.
- I want to thank Alice Lynn McMichael for creating this perfect metaphor.