Critical Data Literacy in the Humanities Classroom
This is a lightly edited and slightly expanded version of my presentation of the same name at DH 2018 in Mexico City.
Good afternoon. Before I get into the topic of digital humanities and data literacy, I want to give everyone some context. I direct LEADR, a digital humanities and social science lab in the departments of History and Anthropology departments at Michigan State University.
That means that my staff and I spend most of our time working with faculty to construct digital assignments that fit into courses taught by other faculty. We try to think not only about how we can formulate projects that meet the disciplinary content goals of the course, but also what skills and approaches we’re teaching, how those skills fit into larger liberal educational goals, and what kinds of things students are walking away with.
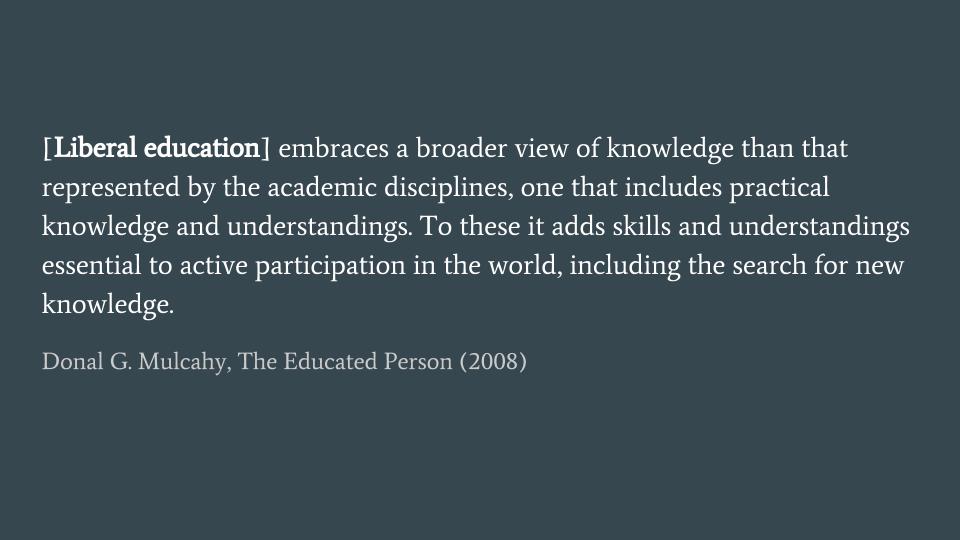
When I talk about liberal education, I’m refering to the idea that an undergraduate program should emphasize critical inquiry and impart students with practical knowledge and skills that are useful to them as citizens and humans—not just as History or Anthropology majors or as Animal Science, Business, or Engineering majors.
Faculty in the humanities often conceive of their courses as spaces where students can learn how to analyze evidence, develop arguments based on that evidence and secondary scholarship, and effectively communicate these arguments.
Digital humanities pedagogy affords us the ability to expand on this idea, and specifically to expand on our ideas of what a source or what evidence is, how we may go about analyzing and working with these sources, and how we’re communicating our arguments and ideas.[1]
Today I want to specifically focus on the use of data in the humanities classroom—I’ll talk about the “everyday” uses of data we can map data literacy to, and discuss how we can integrate these data skills into a classroom with limited time for hands-on data work.
For many students-particularly those who aren’t conducting research in the sciences-data is something they hear about a lot, don’t see often, and work with much less often. Since so many students are so new to the use of data, it can be difficult to determine where to start, and what skills and literacies need to be included.
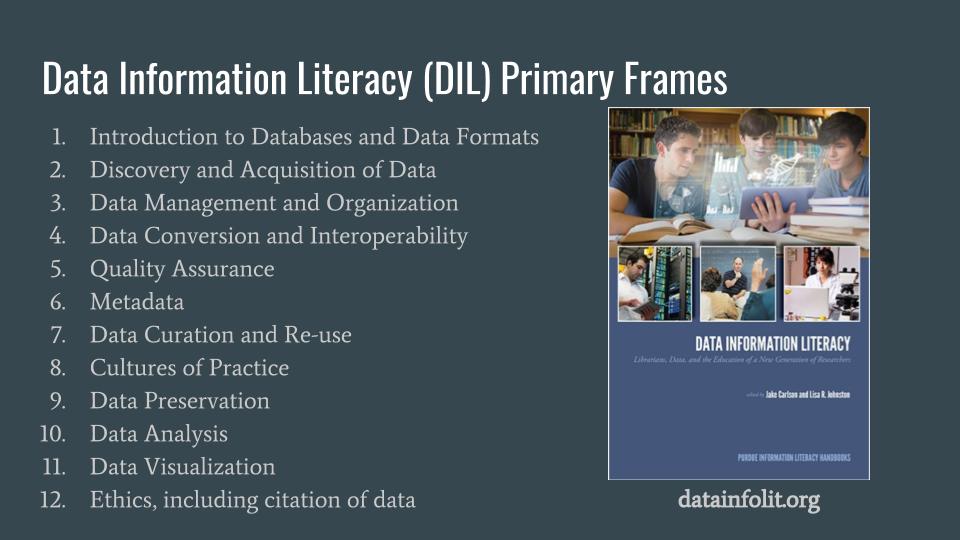
There are lots of different frameworks and guides out there that could be used for data literacy[2]. The one I like the most is the Data Information Literacy (DIL) initiative. Although it’s not necessarily designed for the undergraduate humanities classroom, the frames helpfully break down the kinds of things one must know to work with data, and the approach that focuses on situating teaching within the practices of the field is crucially important.
In thinking about applying this to liberal education, we may think about how where these skills may be productive for students in their everyday lives. We should try to think about the broader ways in which these skills and literacies can benefit a student outside of the university when developing disciplinary learning.
There are a few different ways where I think we all, as political beings, as parents and children and siblings, and as employers and employees may interact with data or claims about data.
“Calling Bullshit”
Data and data visualization are commonly used in political advocacy, in science and social science results, and in the news, and it’s not always easy to dig in and evaluate some of the underlying assumptions and implied claims. Data literacy provides individuals with tools to critically assess work like this from data collection through the final project. Alberto Cairo and the “Calling Bullshit” project both model approaches to these skills, though they are mostly focused on statistics and visualization.
Creating datasets, aggregating and processing existing data, and digging into and evaluating open data from other researchers can make students much more critical about what claims people are attempting to make with data visualizations, and especially to dig into the data, the underlying assumptions, the potential biases in data collection.
Better Understanding of Data Collection, Surveillance
In addition to reading through specious claims, having experience working with data can help students be more critical of the data collection conducted by tech companies, credit reporting firms, and governments.
Collection of personal data has become a mundane part of everyday life through the surveillance capitalism of Facebook and Google and the practices of law enforcement agencies develop as they gang and terrorism databases and track individuals at scale.
Before NSA’s PRISM program was revealed to the public in 2013, few people really knew what metadata was, or how it could really be used. Kieran Healy’s ‘Using Metadata to Find Paul Revere’ demonstrated the power of metadata really effectively. He pretended to be an 18th century British agent using social network analysis to find people who may be key connectors in the american independence movement by analyzing the rolls of different organizations and groups.
Of course, it doesn’t take a data expert to understand why these are oversteps and can result in negative outcomes for people who become ensnared in data collection, data literacy provides tools to empower students to be more critical of the ways that data collection can overselect, misrepresent, and provide access to more information than may be immediately clear. We can even work in discussion or reading of Virginia Eubanks or Safiya Noble to learn and apply lessons from these ‘real life’ biases to our humanities work.
Civic Data
The ability to use civic data is another way in which data literacy can positively impact our students. Governments are increasingly making the data they have created available for public use, including census data, traffic stops and crime reports, information about schools, restaurant health inspection results, etc. We can also include similar data that may be collected by academic researchers, NGOs, journalists, and watch dog organizations.
Government data publication is often done under the banner of greater transparency. However, this data is often published via APIs or other platforms that require some technical skill to access. Civic data also often comes in strange formats that have been quickly exported without correction or reformatting from proprietary software, and in spaces and formats that don’t make them easily communicable with other useful datasets. That means that the information is out there, but it may not be accessible-or effectively usable-for people who haven’t been trained on data manipulation and analysis.
For example, the State of California releases data regarding the finances of all political campaigns in the state. The database is 80 tables with 35 million records. If you’re thinking, “I’m going to just open up a spreadsheet and find out who is funding this ballot initiative to break California into three separate states…” then I hope that you have some Python skills, some knowledge of California’s data standards, and a few days (or weeks) of free time. The California Civic Data Coalition is a group of journalists and programmers who have worked for years to develop workflows to create simplified and more usable datasets….and all of this work only lowers the bar on one dataset in one state.
Data literacy can increase a person’s ability to use all of the information available to them to hold their governments accountable and to advocate for policies and services.
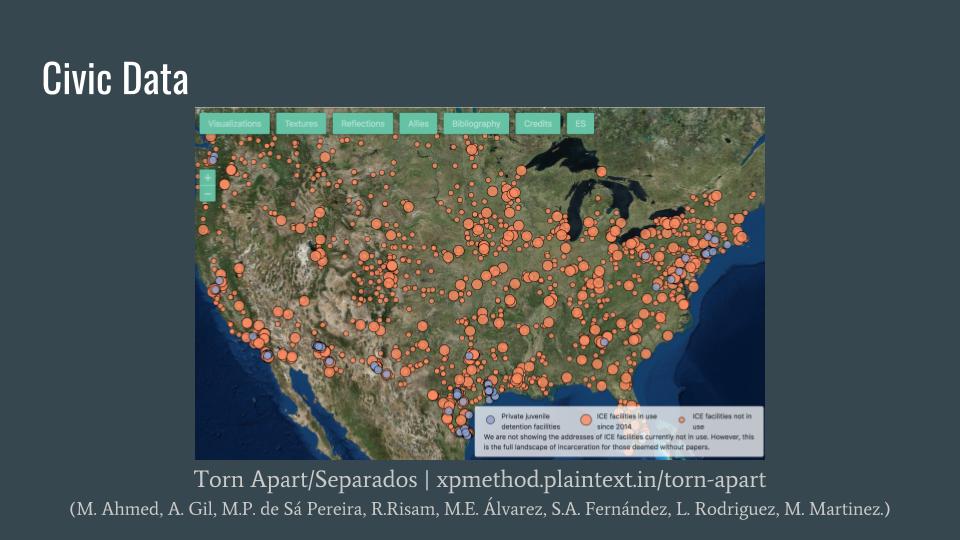
The Torn Apart/Separados project, conceived and launched in about a week, shows the political power that a few private citizens with domain knowledge and technical skill can wield with a few bits of scattered open data.
The Humanities Classroom
So, how can we think about developing data skills in our classrooms?
It can be tempting (and understandably necessary) to focus on data visualization and analysis by giving students datasets that are more or less ready to go. But, as we often hear, data organization is 80% of the work. Not only is that 80% where many important disciplinary/content-based decisions are made, but it’s also where students can gain transferable skills that will help them be more critical of data-centric claims, better understand data surveillance and collection, and be able to effectively use civic data.
What I’m most focused on is trying to have the student work through and take into consideration as much of that 80% as is possible in a limited amount of class time on 15-week schedule.
When students work with data, and especially when they create their own dataset, the gain a much greater understanding of the power that comes from designing tables, choosing schemas and standards, deciding what’s important and what isn’t, what needs to be normalized and what must be retained, what may be obscured or left out, and what claims a visualization may be making, wether explicit or implicit, intentional or not.
Additionally, all of the “everyday life” situations I described earlier benefit from critical thinking about data collection and organization stages and the skills necessary to reorganize and reformat existing datasets. We can’t just focus on the issue of making a spreadsheet show up on the map correctly or being able to read a visualization.
I’m trying to avoid using pre-prepared data packages whenever I can. However, in nearly all cases, the classes have too much other stuff to cover, the datasets are far too complex to expect students to assemble, organize, research, analyze and produce a product in one semester.
To make this possible in the context of a single-semester course, we have to simulate these steps using a series of workshops and discussions.
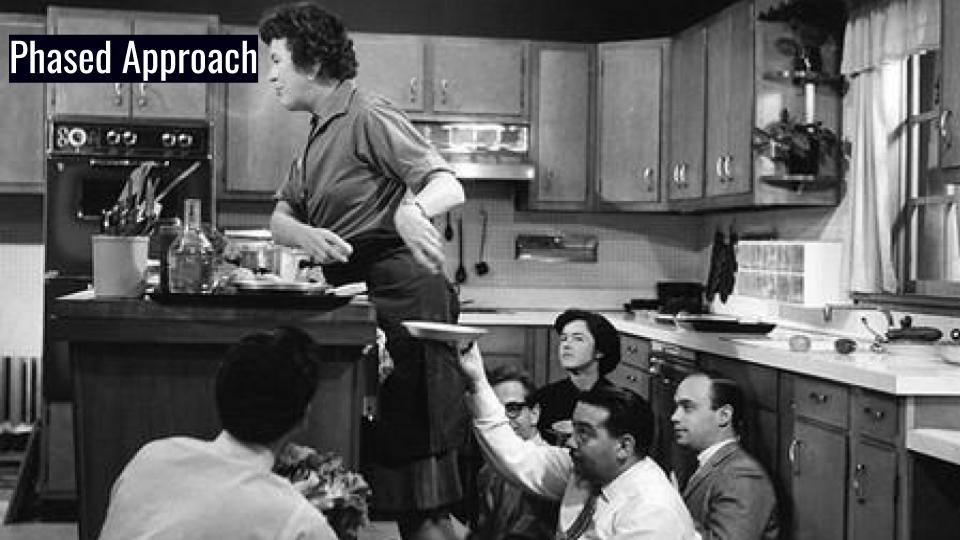
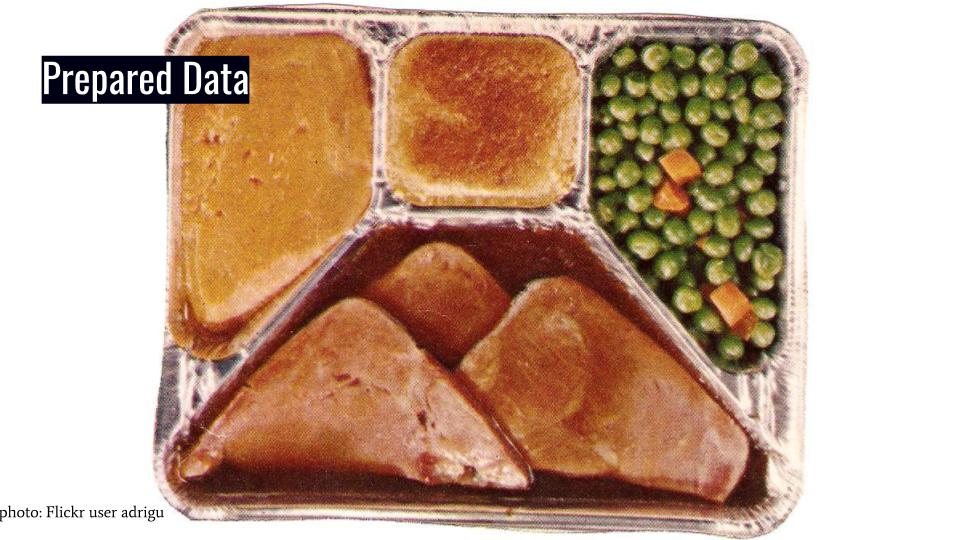
Rather than carrying forward an entire project, students can do part of the work and then get handed the data in a better state. Like a cooking show.[3]
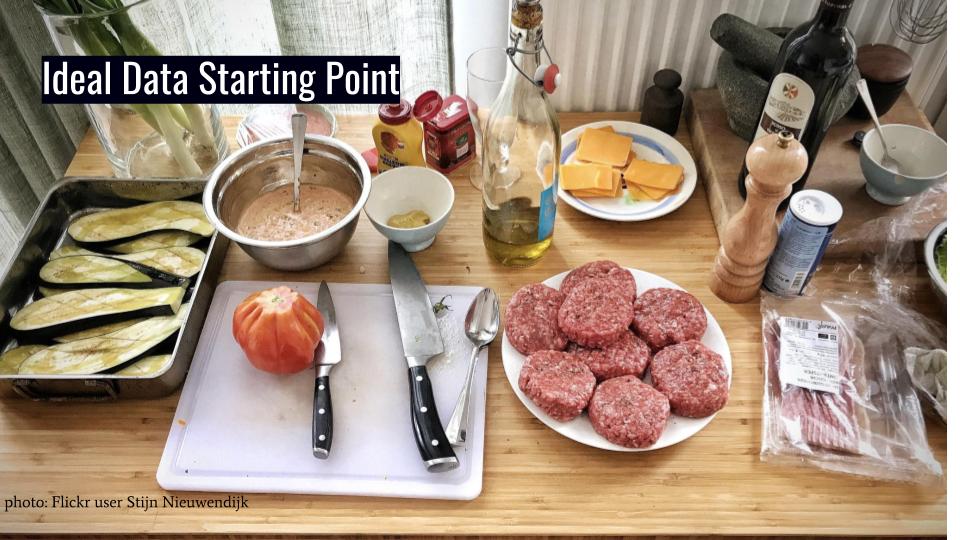
In the first class, we may introduce digital surrogates or physical objects and ask questions about how we may represent them. We can also ask about the ethics of creating this dataset, determine what we need to know about the context in which the objects and/or surrogates were created. We can also talk about metadata fields and standards, determine what types of questions we can ask, how we can create data that facilitates those questions.
For the second session, we may give them a dataset that has been assembled from several different sources and has some inconsistencies. Students can then learn how to work with unorganized or “dirty” data and make sense of what’s given to them. They can learn the headaches of standards and the magic of OpenRefine.
After this step, students can grab a pre-prepared dataset (inasmuch as that is possible) and focus on project-based analysis.
So, in summary, I think it’s important for us to think about the disciplinary goals we want to accomplish, think about the external applications of the skills and knowledges we want students to walk away with, and then develop courses that tie these together, even if it requires piecemeal workshops.

You can scaffold and simulate the type of work students would be doing while keeping it contained within a few classes. This way, students can learn how to think through and solve these problems without having their projects delayed by data issues. If we only focus on a shiny final project or transferrable skills, our students end up like Julia and the tuna.
Classroom and the Future of the Historical Record
Over the next two years, my colleagues and I at Michigan State (Sharon Leon, Alice Lynn McMichael, Alyssa Lopez) will be experimenting with different ways to work with historical data in the undergraduate classroom. We’ll be teaching two data-focused History courses (one 200-level and one 400-level) over two years and assessing student learning throughout the process. We’ll also be working alongside colleagues at the University of Illinois at Urbana-Champaign and the University of Nebraska-Lincoln on similar digital history pedagogical projects. You can read more about our Humanities Without Walls sponsored grant here.
- I go into this in much greater depth in Digital Humanities Pedagogy as Essential Liberal Education: A Framework for Curriciulum Development
- A few data literacy resources:
- Credit goes to Alice Lynn McMichael for introducing me to the cooking show metaphor.